Kennesaw Housing Market Report: Q1 2026
Atlanta Home Network · Published June 2026
Executive Summary
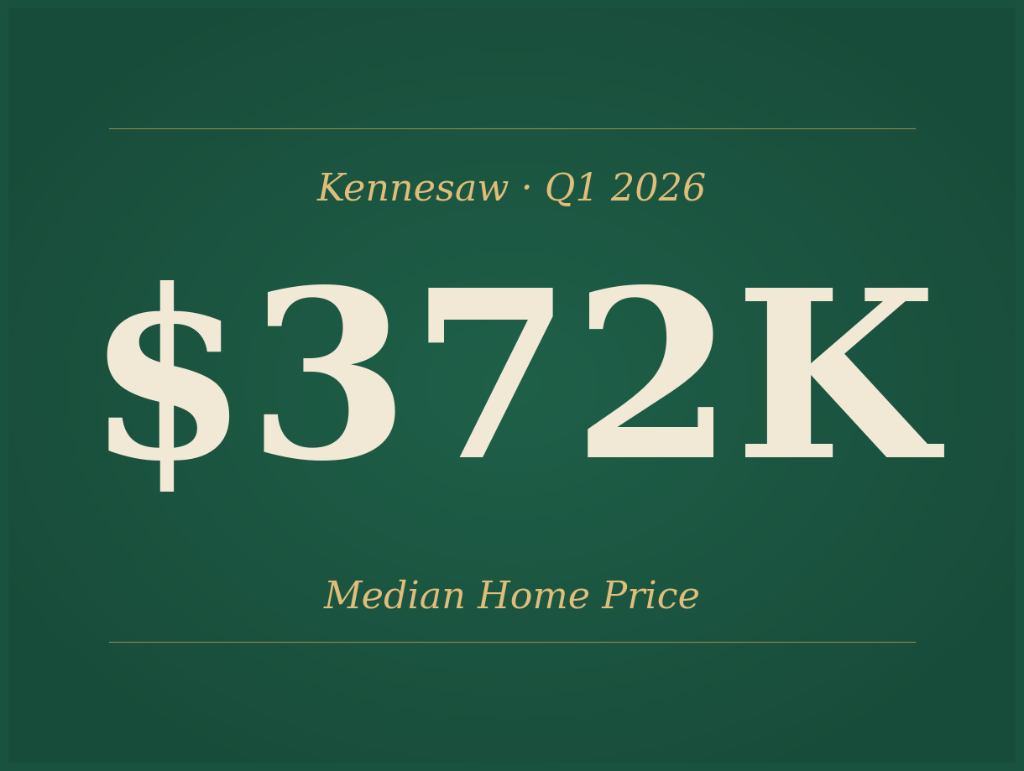
The City of Kennesaw recorded 132 open-market home sales in the first quarter of 2026, according to Cobb County property records analyzed by Atlanta Home Network. The median sale price for the quarter was $372,500, $47,500 below the Cobb County median of $420,000. Kennesaw is the most affordable city-level market in Cobb among the cities we have reported on this year, sitting well below Marietta's Q1 median of $590,000 and Smyrna's $485,000.
Quarterly pricing in Kennesaw was nearly flat, with the median moving from $374,235 in January to $375,000 in March. Investor purchases accounted for 21.2 percent of Q1 closings, modestly below the Cobb County baseline of 27.1 percent. The investor share was volatile by month, dropping from 28.9 percent in January to 16.2 percent in February before recovering to 19.3 percent in March. Preliminary April data shows the investor share rising again to 28.6 percent.
Quick Read by Reader Type
If you currently own a Kennesaw home: Median prices held steady through Q1 rather than climbing. The strongest price segment is $200,000 to $350,000, which accounted for 39 percent of all Q1 sales. Demand exists, but Kennesaw is not seeing the rapid price escalation we documented in Smyrna and Marietta.
If you are shopping for a Kennesaw home: Roughly half of Cobb County households can afford the median Kennesaw home with a 20 percent down payment at current mortgage rates. That is the broadest qualifying pool of any city we have reported on so far. The $200,000 to $350,000 band produced 51 Q1 sales, the deepest entry-level inventory in Cobb.
If you are renting in Kennesaw and considering buying: Kennesaw is the natural starter-home market in Cobb. The under-$350,000 band represents 42 percent of Q1 sales (56 closings). Cash required at closing for a median home with 20 percent down is approximately $86,000. With 10 percent down, the income threshold rises to about $113,000 but cash needed drops to about $43,000.
If you are an investor: Kennesaw's investor share runs below the Cobb County baseline but is volatile by month, swinging from 16 percent to 29 percent in a single quarter. April activity suggests investor interest is returning. Yield-focused buyers should watch the under-$350,000 band, which represents over 40 percent of city volume.
What's Selling at Each Price Point
| Price Band | Q1 Sales | If You're Selling | If You're Buying |
|---|---|---|---|
| Under $200,000 | 5 | Very thin inventory; condition matters | Mostly older condos and townhomes |
| $200,000 to $350,000 | 51 | The hottest band in Kennesaw; strong first-time buyer demand | Largest selection in Cobb's entry-level price range |
| $350,000 to $500,000 | 47 | Solid mid-market demand; well-priced homes move within four weeks | Good selection of single-family and townhomes |
| $500,000 to $750,000 | 24 | Smaller buyer pool than mid-market; price discipline matters | Less competition than the bands below |
| $750,000 to $1 million | 1 | Very thin upper end | Almost no Q1 activity in this band |
| Above $1 million | 4 | Reflects 3 batch sales at $1.57M and one $1.35M transaction | True open-market luxury inventory is very limited |
Sales Activity
Sales volume in Kennesaw was flat through January and February, then jumped in March:
| Month | Open-Market Sales | Median Sale Price |
|---|---|---|
| January 2026 | 38 | $374,235 |
| February 2026 | 37 | $360,000 |
| March 2026 | 57 | $375,000 |
| Q1 Total | 132 | $372,500 |
March alone accounted for 43 percent of the quarter's total volume. The pickup matches a typical late-winter to early-spring buying pattern, with closings concentrated in the second half of the quarter.
The Median Sale Price (and Why We Don't Use the Average)
The median sale price for Kennesaw in Q1 2026 was $372,500. The average was $429,992. The two numbers tell different stories.
The median represents the typical home buyer's reality. Half of Kennesaw homes sold for more than $372,500 in Q1; half sold for less.
The average is pulled upward by three batch sales recorded at exactly $1,573,000 each (on Hillsborough Chase, Bancroft Main, and Wellcrest Drive) and a four-parcel developer batch on Kinnard Alley at $686,160 each. If we set aside batch transactions above $1 million, the Kennesaw Q1 average would be closer to $395,000, much closer to the median.
For homeowners checking their home value or buyers budgeting for a purchase, the median sale price of $372,500 is the figure to use.
Price Per Square Foot
The median price per square foot in Kennesaw for Q1 2026 was $214, measured across 118 sales where both price and square footage were recorded.
That figure matches the county-wide March median of $221 within a few dollars. Kennesaw's median home size in Q1 was 1,574 square feet, smaller than both Marietta (2,030) and Smyrna (1,804). Kennesaw buyers get roughly the same per-square-foot pricing as the rest of Cobb, but in smaller, more affordable homes.
Most Active Neighborhoods
Four Kennesaw neighborhoods ranked high in Q1 sales volume, with three or more closings each:
| Neighborhood | Q1 Sales | Median Sale Price |
|---|---|---|
| East Park Village Townhomes | 19 | $571,800 |
| Lullwater | 6 | $457,000 |
| Kennesaw Battle Condos | 5 | $350,000 |
| Stilesboro Cove | 4 | $291,750 |
East Park Village Townhomes alone accounted for 14 percent of all Q1 Kennesaw sales, with closings tightly clustered in the $560,000 to $590,000 range.
Notable Transactions
Three patterns defined Kennesaw's upper end in Q1.
Multi-property batch sale: Three Kennesaw addresses (Hillsborough Chase, Bancroft Main, Wellcrest Drive) each recorded sales at exactly $1,573,000 in Q1. The identical price and same recording period indicate a portfolio transaction rather than three independent ultra-luxury sales. These three entries inflate the quarterly average but have no effect on the median.
Developer closeout: Four parcels on Kinnard Alley closed at exactly $686,160 in a single batch, consistent with a new-home developer transferring multiple units in one filing. Counts as four sales in the data but reflects one transaction event.
Highest open-market single-family sale: $1,349,000 at 1200 Willow Court, located within the Kennesaw Mountain High School attendance zone. Other Q1 single-family sales in the $700,000 to $850,000 range concentrated in the West Kennesaw and Kennesaw Mountain neighborhoods.
Affordability
Kennesaw is the most accessible city-level market in Cobb among the cities we have reported on so far.
| Scenario | Income Required | Cash Needed at Closing |
|---|---|---|
| 20% down payment | $100,000 | $86,000 |
| 10% down payment | $113,000 | $43,000 |
The $100,000 income threshold is approximately 1.07 times the Cobb County median household income of $93,000. By rough estimate, half of Cobb County households earn enough to qualify for a median-priced Kennesaw home with 20 percent down. That ratio is meaningfully lower than Smyrna (1.35x) and Marietta (1.65x).
Calculations assume a 7 percent 30-year fixed mortgage, 28 percent front-end debt-to-income limit, and approximately $400 per month in taxes and insurance.
Who Is Buying in Kennesaw?
Kennesaw's buyer mix sits between the Cobb County baseline and the lower-investor pattern of Smyrna.
| Buyer Type | Kennesaw Q1 | Cobb County Q1 |
|---|---|---|
| Moving into the home | 56.1% | 59.1% |
| Likely investor (LLC, corporate, or out of state) | 21.2% | 27.1% |
| Unclear from records | 22.7% | 13.8% |
The investor share of 21.2 percent runs 5.9 percentage points below the county baseline. It was the most volatile of any city we covered in Q1: 28.9 percent in January, 16.2 percent in February, 19.3 percent in March. Preliminary April data shows the share returning to 28.6 percent, near the county average.
The higher "unclear" share in Kennesaw reflects more transactions where the buyer's classification could not be determined from the public record alone. We continue to refine this segmentation as additional county data feeds become available.
If You Own a Home in Kennesaw and Are Thinking About Selling
The Q1 numbers suggest Kennesaw is a steady, transaction-heavy market rather than a rapid price-appreciation market. The median moved only $765 over the quarter (about 0.2 percent), the smallest move of any Cobb city we have reported on.
Three practical questions to ask yourself:
-
Is your home in the $200,000 to $350,000 band? That band took 39 percent of all Q1 closings. Demand is the strongest in Kennesaw and well-priced homes tend to receive offers within three to four weeks.
-
Is your home a townhome or condo? Townhome activity in Kennesaw is highly concentrated in a handful of communities. East Park Village alone accounted for 19 closings in Q1. If your community has comparable recent sales, presentation and pricing matter more than market timing.
-
Is your home above $500,000? Q1 demand thinned above $500,000, with only 29 closings combined. Plan for a longer time on market and a smaller buyer pool. Sellers in this range should price against the Marietta and East Cobb premium markets, not against the Kennesaw median.
If You Are Buying a Home in Kennesaw
Three patterns from Q1 are worth knowing.
Kennesaw offers the broadest affordability in Cobb. The median home requires roughly $100,000 in annual household income to purchase with 20 percent down. That is approximately 1.07 times the Cobb median household income, versus 1.35 times for Smyrna and 1.65 times for Marietta. About half of Cobb households qualify to purchase the median Kennesaw home.
The $200,000 to $350,000 band has the most inventory. With 51 closings in Q1, this band offers the best selection for first-time buyers anywhere in Cobb.
Investor competition varies month to month. Investor share swung from 16 percent to 29 percent across the quarter. If you are bidding against an investor buyer, that buyer is more likely to be cash-funded with a faster close, but less likely to compete aggressively on price. Move-in buyers can often win these deals on terms.
Kennesaw vs Cobb County: Side-by-Side
| Metric | Kennesaw | Cobb County |
|---|---|---|
| Total open-market sales | 132 | 2,807 |
| Median sale price | $372,500 | $420,000 |
| Median $/sqft | $214 | $214 |
| Share moving in | 56.1% | 59.1% |
| Share likely investor | 21.2% | 27.1% |
Kennesaw represents 4.7 percent of Cobb County's total Q1 sales volume. The city's median sits $47,500 below the county median, making it the entry-level end of Cobb's homeownership market.
A Wider Look: School Zones
Kennesaw splits between two Cobb County high school zones, Kennesaw Mountain High and North Cobb High. We do not break out school-zone-level pricing in this report because the city boundary and the high school attendance zone boundaries do not align cleanly. A dedicated Cobb Home Sales by School District deep dive is in development.
Want the Full Data?
The complete Kennesaw Q1 2026 report (11-page PDF) includes additional charts, the full methodology, and analytical breakdowns suitable for citation. Download the full report.
Work with Atlanta Home Network
We make our data and editorial platform available to organizations that want to reach metro Atlanta homeowners and movers. Reach out about:
- Data licensing - Purchase the underlying dataset for your own analysis or marketing
- Custom insights - Private analyses of specific submarkets, buyer segments, or competitive positioning
- Partnerships - Editorial co-publishing with local newsrooms and adjacent publications
- Sponsored placement - Featured posts adjacent to our reports, with clear sponsor labeling
Email editor@atlantahomenetwork.com to start a conversation.
This report is based on home sales recorded in Cobb County public records between January 1, 2026 and March 31, 2026, reviewed by Atlanta Home Network.
We focus on open-market sales, meaning transactions where a property changed hands at a fair price between two unrelated parties. We exclude family transfers, gift deeds, $0 or $1 placeholder transactions, and same-day chain transactions tied to estate or divorce administration. After filtering, 132 open-market sales remained for Q1 within Kennesaw city limits.
We classify sales as Kennesaw based on Cobb County's tax district designation (district 3), which corresponds to properties inside the City of Kennesaw's city limits. The Kennesaw Mountain High and North Cobb High attendance zones extend into adjacent unincorporated Cobb and are not used as the geographic frame for this report.
Several batch transactions were kept in the sales count and median price as recorded, but their effect on the average price is noted explicitly throughout. We believe the median sale price is the most reliable summary for any market where a small number of large deals would otherwise distort the average.
For full details on our data sources, filtering rules, and editorial standards, see our Methodology page.
Public county records may lag current activity and may differ from MLS-based reporting. We review our methodology quarterly.
Atlanta Home Network publishes monthly housing market reports for metro Atlanta counties and cities. The next Kennesaw report will cover April 2026 activity and be published in early July 2026.
Have feedback on this report? Contact us at editor@atlantahomenetwork.com.