Marietta Housing Market Report: Q1 2026
Atlanta Home Network · Published May 2026
Executive Summary
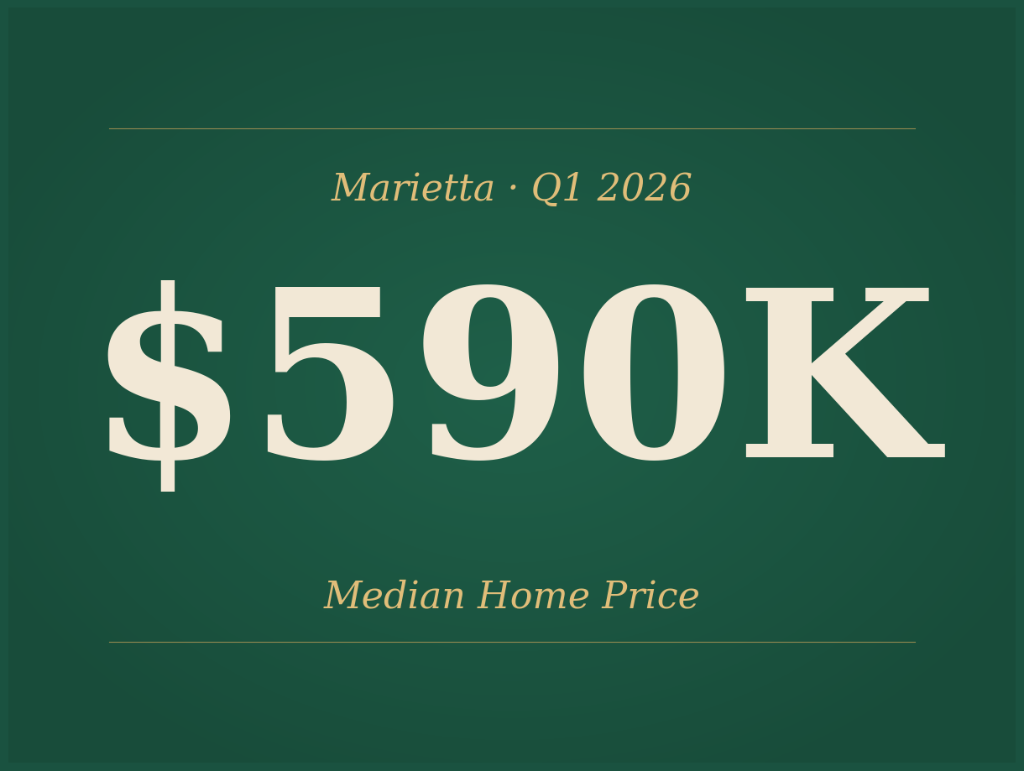
The City of Marietta recorded 223 open-market home sales in the first quarter of 2026, according to Cobb County property records analyzed by Atlanta Home Network. The median sale price for the quarter was $590,000, about 40 percent higher than the Cobb County median sale price of $420,000. Prices rose steadily through the quarter, with the median sale price climbing from $538,750 in January to $619,000 in March.
Marietta also stands apart from the rest of Cobb in the type of buyer purchasing homes. About 4 in 10 closed sales went to an investor or out-of-state buyer, compared to roughly 3 in 10 across the broader county.
What This Means for You
If you own a home in Marietta: Median sale prices in Marietta rose 15 percent over Q1, faster than the broader county. If your home is in the $500,000 to $750,000 band, you sit inside the most active price range. Spring 2026 looks like a stronger pricing window than late 2025.
If you're buying in Marietta: Expect serious competition. About 39 percent of Q1 buyers were investors or out-of-state purchasers, well above the county average. The largest single price band is $500,000 to $750,000, where 63 homes closed in Q1. Below $350,000, inventory is thin and competition with investors is the most intense.
If you're renting and considering a purchase: The under-$350,000 band represents about 21 percent of Q1 sales. There is supply at that level, but it sells fast and faces the most investor competition. Get pre-approved before viewing homes.
If you're an investor: Marietta's investor share is now meaningfully above the Cobb baseline. Yield compression is more likely than a quick flip. The opportunity remains in long-term hold properties in the historic Marietta Square area.
What's Selling at Each Price Point
| Price Band | Q1 Sales | If You're Selling | If You're Buying |
|---|---|---|---|
| Under $200,000 | 14 | Very thin inventory; almost certainly multiple offers if priced fairly | Limited choices, expect investor competition, condos and small bungalows dominate |
| $200,000 to $350,000 | 32 | Strong demand from first-time buyers AND investors | Most competitive segment; pre-approval and quick action essential |
| $350,000 to $500,000 | 40 | Solid mid-market demand; price right and expect interest within 2-3 weeks | Decent inventory; good fit for first-time buyers in established neighborhoods |
| $500,000 to $750,000 | 63 | The hottest band in Marietta in Q1; 28 percent of all sales | Largest selection of homes; less investor competition than below $500k |
| $750,000 to $1 million | 20 | Smaller buyer pool; presentation and marketing matter | More room to negotiate; longer time-to-close is normal |
| Above $1 million | 54 | Premium market, with several large multi-property deals inflating this count | True open-market luxury inventory is smaller than the number suggests |
Sales Activity
Sales activity in Marietta built through the quarter:
| Month | Open-Market Sales | Median Sale Price |
|---|---|---|
| January 2026 | 58 | $538,750 |
| February 2026 | 66 | $552,500 |
| March 2026 | 99 | $619,000 |
| Q1 Total | 223 | $590,000 |
March alone accounted for 44 percent of the quarter's total volume, consistent with the seasonal pattern where home sales pick up through Q1 ahead of the busier summer market.
The Median Sale Price (and Why We Don't Use the Average)
The median sale price for Marietta in Q1 2026 was $590,000. The average was $2,127,074. The two numbers tell different stories.
The median sale price represents the typical home buyer's reality. Half of Marietta homes sold for more than $590,000 in Q1; half sold for less.
The average is pulled sharply upward by a small number of very large deals. The most consequential was a $58.25 million multi-property transaction recorded against 1113 Powers Ferry Place in February. Several batch new-home developer closings at roughly $4.3 million each also distorted the average.
If we set aside transactions above $5 million, the Marietta Q1 average would be closer to $750,000, still above the median but a much more sensible reference point.
For homeowners checking their home value or buyers budgeting for a purchase, the median sale price of $590,000 is the figure to use.
Price Per Square Foot
The median sale price per square foot in Marietta for Q1 2026 was $231, measured across 166 sales where both price and square footage were recorded in public records.
By comparison, the county-wide middle was $221 per square foot in March. Marietta's premium reflects both the older, smaller housing stock common to the city (median size around 2,030 square feet) and the desirability of the historic Marietta Square area.
A quick reference for buyers: a 2,000 square foot home priced at $475,000 in Marietta is below the city's average price per square foot, suggesting reasonable value if the home is well maintained. The same home priced at $525,000 sits at market.
Largest Sales of the Quarter
The biggest residential transactions in Marietta during Q1 2026:
| Sale Price | Address | Notes |
|---|---|---|
| $58,250,000 | 1113 Powers Ferry Place | Multi-property portfolio sale; treated as a single event |
| $12,433,100 | 238 Machelle Lane | Single sale |
| $12,433,100 | 140 Coryell Street | Separate sale at the same recorded price |
| $4,324,794 | 2234 Gardenwalk Way | Part of a batch new-home developer closing |
| $4,324,794 | 2217 Gardenwalk Way | Part of the same batch |
| $4,324,794 | 2230 Gardenwalk Way | Part of the same batch |
| $4,324,794 | 2237 Gardenwalk Way | Part of the same batch |
Outside of these large and batch transactions, the highest open-market single family sales in Marietta during Q1 ranged between roughly $1.5 million and $3 million, distributed across the Marietta Square historic district and the neighborhoods on the city's eastern edge near East Cobb.
Who Is Buying in Marietta?
Marietta's buyer mix differs meaningfully from the broader Cobb County market.
| Buyer Type | Marietta Q1 | Cobb County Q1 |
|---|---|---|
| Moving into the home | 53.4% | 59.1% |
| Likely investor (LLC, corporate, or out of state) | 39.0% | 27.1% |
| Unclear from records | 7.6% | 13.8% |
The 39 percent investor share is about 12 percentage points higher than the Cobb County average. A few likely reasons:
- Marietta contains more small multifamily homes, townhomes, and condos than unincorporated Cobb, and these attract more investor purchases.
- The Marietta Square area continues to draw long-term hold buyers from outside Georgia.
- The cluster of large multi-property deals identified above is reflected in this share. Setting them aside, the share of buyers moving in would rise to roughly 60 percent, much closer to the county-wide pattern.
By contrast, neighboring Smyrna recorded an investor share of just 22.7 percent in Q1, modestly below the Cobb baseline. The two cities sit a few miles apart but show opposite buyer compositions.
If You Own a Home in Marietta and Are Thinking About Selling
The Q1 numbers suggest that spring 2026 is a stronger pricing environment than late 2025. The median sale price rose 15 percent during the quarter, faster than the broader county's 9.4 percent.
Three practical questions to ask yourself:
Is your home in the $500,000 to $750,000 band? That band took 28 percent of all Q1 closings. Demand is strong, and homes priced correctly in this band tend to receive multiple offers within two to three weeks.
Is your home below $350,000? Demand is strong but inventory is thin, and you will likely compete with investor offers. Investor offers are often quick and cash but typically come in 5 to 10 percent below asking. Get a market analysis before listing so you can compare investor offers against likely open-market value.
Is your home above $750,000? Expect a longer time on market and a smaller buyer pool. Marketing and presentation matter more here than in the mid-band. Plan for 60 to 90 days from list to close in this segment.
For homeowners not in a rush to move, the data suggests there is no urgency to list before late summer. Prices have risen steadily, and the seasonal pattern points to continued spring strength.
If You Are Buying a Home in Marietta
Three patterns from Q1 are worth knowing.
You will face investor competition, particularly under $500,000. About 4 in 10 buyers in Q1 were investors or out-of-state purchasers. The lower the price, the higher the share. Practical implications:
- Get pre-approved before you start touring homes
- Be prepared to make offers within 48 hours of viewing
- Investors typically waive contingencies. You can compete by writing clean offers with shorter inspection periods, not by simply going higher in price.
The $500,000 to $750,000 band has the most inventory. If your budget reaches this range, you will see the most choices. The investor share in this band is meaningfully lower than below $500,000, so you are competing more often with other people moving in.
Watch the price per square foot, not just the total price. Marietta's older housing stock means square footage varies widely. A $550,000 home with 2,400 square feet is priced more attractively per square foot than a $550,000 home with 1,800 square feet. The city's middle is $231 per square foot; use that as a quick benchmark.
Should You Wait or Act Now?
There is no universally right answer, and Atlanta Home Network does not give individual buying or selling advice. But the data offers a few honest observations.
For sellers, waiting carries the cost of paying your existing mortgage another month or two. The data does not show evidence that prices will be substantially higher in August than they are in May, though seasonal demand peaks in late spring and early summer.
For buyers, the question is more nuanced. Mortgage rates have been the dominant variable for the last two years. The Q1 data does not suggest prices are falling, so waiting for "the market to cool" is unlikely to help in Marietta specifically. The more common scenario for waiting buyers is that affordability stays similar while inventory choices change month to month.
For both groups, the steady upward trend in the median sale price over Q1 suggests the market is functioning normally rather than overheating or correcting. That is generally a healthy environment in which to make a decision based on your personal circumstances rather than timing the market.
Marietta vs Cobb County: Side-by-Side
| Metric | Marietta | Cobb County |
|---|---|---|
| Total open-market sales | 223 | 2,807 |
| Median sale price | $590,000 | $420,000 |
| Median $/sqft | $231 | $214 |
| Share moving in | 53.4% | 59.1% |
| Share likely investor | 39.0% | 27.1% |
Marietta represents 7.9 percent of Cobb County's total Q1 sales volume but a meaningfully different mix of buyer types and price points. Think of Marietta as a distinct market within Cobb rather than a representative slice of county-wide activity.
A Wider Look: Marietta High School Zone
For readers using the Marietta High School attendance zone as their geographic frame (this extends slightly beyond city limits into adjacent unincorporated Cobb), Q1 2026 totals were:
- Total Q1 sales: 160
- Median sale price: $520,000
- Average sale price: $726,124
The Marietta High zone middle of $520,000 sits below the Marietta city limits middle of $590,000, reflecting the slightly lower-priced unincorporated areas that the school zone reaches.
Want the Full Data?
The complete Marietta Q1 2026 report (11-page PDF) includes additional charts, the full methodology, and analytical breakdowns suitable for citation. Download the full report.
Work with Atlanta Home Network
We make our data and editorial platform available to organizations that want to reach metro Atlanta homeowners and movers. Reach out about:
- Data licensing, Purchase the underlying dataset for your own analysis or marketing
- Custom insights, Private analyses of specific submarkets, buyer segments, or competitive positioning
- Partnerships, Editorial co-publishing with local newsrooms and adjacent publications
- Sponsored placement, Featured posts adjacent to our reports, with clear sponsor labeling
Email editor@atlantahomenetwork.com to start a conversation.
This report is based on home sales recorded in Cobb County public records between January 1, 2026 and March 31, 2026, reviewed by Atlanta Home Network.
We focus on open-market sales, meaning transactions where a property changed hands at a fair price between two unrelated parties. We exclude family transfers, gift deeds, $0 or $1 placeholder transactions, and same-day chain transactions tied to estate or divorce administration. After filtering, 223 open-market sales remained for Q1 within Marietta city limits.
We classify sales as Marietta based on Cobb County's tax district designation, which corresponds to properties inside the City of Marietta's city limits. The Marietta High School attendance zone, reported separately above, is a broader geographic frame.
Several large multi-property and batch new-home transactions were kept in the sales count and median sale price as recorded, but their effect on average price is noted explicitly throughout. We believe the median sale price is the most reliable summary for any market where a small number of large deals would otherwise distort the average.
For full details on our data sources, filtering rules, and editorial standards, see our Methodology page.
Public county records may lag current activity and may differ from MLS-based reporting. We review our methodology quarterly.
Atlanta Home Network publishes monthly housing market reports for metro Atlanta counties and cities. The next Marietta report will cover April 2026 activity and be published in early June 2026.
Have feedback on this report? Contact us at editor@atlantahomenetwork.com.